


Part 2 of the Synthetic ECG/EKG Waveform Series
Series note: In Part 1: 4 ECG Waveforms For Paramedic & Critical Care Scenarios, we covered four conduction and rate problems: AV block 2nd degree Mobitz II, AV block 2:1, ventricular paced rhythm, and pre-excited atrial fibrillation.
This second release is a different kind of challenge. All four waveforms below are ST/T pattern recognition problems: acute pericarditis, Brugada type 1, De Winter T waves, and lateral STEMI. Two are STEMI mimics and two are true ischemia.
Summary
What this article covers: Four 12-lead ECG waveforms (acute pericarditis, Brugada type 1, De Winter T waves, and lateral STEMI), including the electrophysiology behind each, the key diagnostic features learners should identify, the target learner cohort, and strategies to simplify or challenge each rhythm in simulation.
Who it is for: simulation educators, paramedic and nursing faculty, emergency medicine and critical care trainers, and ACLS instructors.
Where to download: all four waveforms are available through theSimTech ECG/EKG Images Squiggler Database. These are simulation-ready synthetic waveforms built on Squiggler.io
Why ST/T Pattern Recognition Deserves Its Own Release
In emergency and critical care simulation, few findings carry as much consequence as ST-segment and T-wave changes.
A single ECG can send a patient to the catheterization laboratory, to an electrophysiology consult, to an observation bed, or home on anti-inflammatory therapy. Learners who over-call mimics expose patients to unnecessary anticoagulation, thrombolysis, or invasive procedures. Learners who under-call subtle STEMI equivalents delay reperfusion while myocardium is lost.
That asymmetry is exactly why these waveforms make such powerful simulation stimuli: the same skill, careful and systematic ECG interpretation, produces completely different clinical decisions depending on what the tracing shows.
Clean, artifact-free tracings matter even more here than they do for rhythm recognition. ST deviation is judged in millimeters, and baseline wander, muscle tremor, or poor print quality can turn a diagnostic ECG into a guessing game. Synthetic, high-fidelity waveforms ensure that learners are assessed on their diagnostic reasoning rather than their ability to look past visual clutter.
The four waveforms below are ordered from a common mimic to the most subtle STEMI equivalent, ending with the classic territorial infarct that every learner must be able to recognize quickly. Each section outlines the electrophysiological mechanism, the key features to look for, the appropriate learner level, and two deployment strategies: one to simplify the concept for earlier learners and one to challenge advanced learners with realistic clinical pressure.
A note on reading these descriptions: the sections below use classic textbook criteria. Where the synthetic waveform provided with this post differs in lead distribution, as it does for the De Winter changes and the lateral STEMI elevation, we say so, so learners can compare the textbook description with the image.
At a Glance: The Four Waveforms
| Waveform | Category | Key recognition features | Target learners | Main simulation risk |
|---|---|---|---|---|
| Acute pericarditis | STEMI mimic | Diffuse concave ST elevation, PR depression, ST depression and PR elevation in aVR | Intermediate | Inappropriate STEMI activation or thrombolysis |
| Brugada type 1 | STEMI mimic / channelopathy | Coved ST elevation of at least 2 mm in V1–V2 followed by an inverted T wave | Advanced | Missed ventricular arrhythmia risk, harmful drug choice |
| De Winter T waves | STEMI equivalent | Upsloping ST depression between V1 and V6, tall symmetric T waves, ST elevation in aVR | Advanced and specialist | Missed LAD occlusion because no classic ST elevation |
| Lateral STEMI | True ischemia | ST elevation in I, aVL, V5–V6 with inferior reciprocal depression | Intermediate to advanced | Delayed reperfusion from a subtle or underrecognized infarct |
1. Acute Pericarditis
Download this waveform via theSimTech ECG/EKG Images Squiggler Database.
Electrophysiological Overview
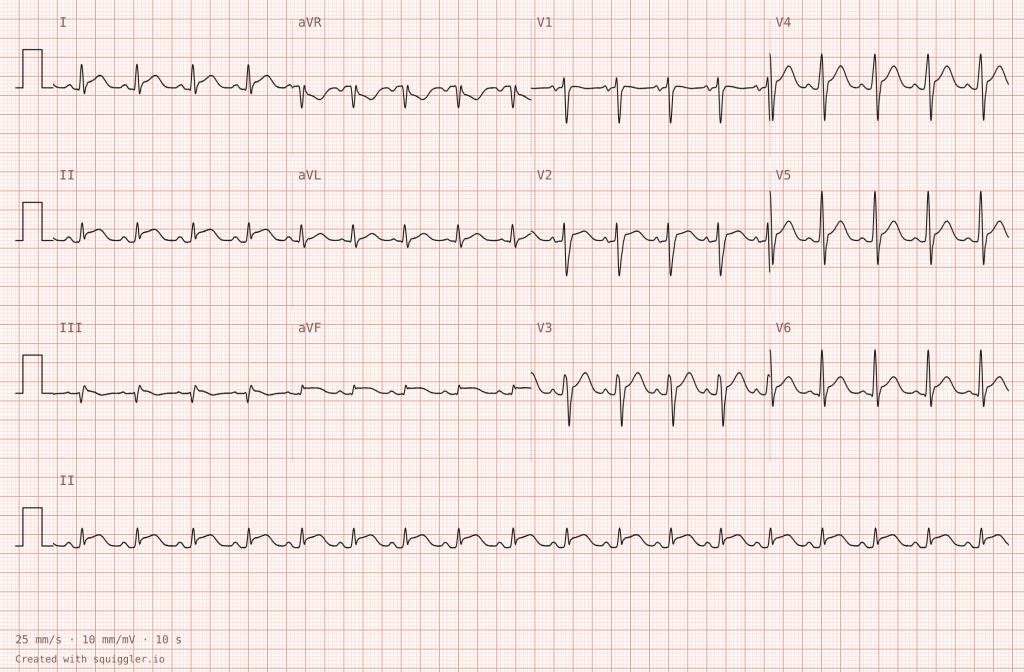
Acute pericarditis is inflammation of the pericardial sac, most often viral or idiopathic, though it can also follow myocardial infarction or cardiac surgery, or accompany autoimmune disease, uremia, or malignancy. The ECG changes arise because the inflammation irritates the epicardial surface of the myocardium, producing a diffuse injury current that is not confined to a single coronary territory. The result is widespread, concave-upward (saddle-shaped) ST-segment elevation across most of the limb and precordial leads, typically accompanied by PR-segment depression in the same leads.
Lead aVR usually shows the mirror image: ST depression with PR elevation, and lead V1 often shows a similar pattern. Unlike a STEMI, there are no true reciprocal ST depressions in other leads, and T waves typically remain upright early in the course. Over days to weeks, an untreated tracing may evolve through ST normalization and T-wave inversion before returning to baseline.
Key Diagnostic Features
- Diffuse, concave-upward ST elevation across multiple leads that does not follow a single coronary artery territory
- PR-segment depression in most leads, with PR elevation in aVR (a classic finding that can be subtle on a given tracing)
- ST depression in aVR (and often V1), the only leads where mirror-image change is expected
- No pathological Q waves and no reciprocal ST depression elsewhere
- Relatively preserved T-wave amplitude early in the course; a higher ratio of ST elevation to T-wave height in V6 (commonly cited as 0.25 or greater) helps separate pericarditis from benign early repolarization
Target Learner Cohort
Intermediate: Paramedic students in advanced training, emergency and critical care nursing staff, and Emergency Medicine residents. It also works as a contrast waveform for advanced learners who are practicing STEMI discrimination.
Pedagogical Strategy
Simplifying the Concept
Use this waveform to teach the territory test. Ask learners to highlight every lead with ST elevation and then decide whether those leads map to one coronary artery. In pericarditis they do not, because the elevation is nearly global. Pairing the tracing with a printed lead-group map (inferior, lateral, anterior, septal) lets novices see the difference between a regional infarct pattern and a diffuse inflammatory one without needing to memorize a long list of criteria. The PR-segment depression and the opposite-polarity changes in aVR give learners two concrete visual anchors they can check on every future ECG.
Challenging the Learner
Build a scenario around a young patient with pleuritic, positional chest pain that improves when leaning forward, preceded by a recent viral illness. When the learner obtains the ECG, the monitor and the patient’s distress both push toward a reflexive STEMI activation. The learner must resist that reflex, document the absence of territorial distribution and reciprocal change, and avoid anticoagulation or thrombolytic therapy, which is inappropriate in pericarditis and could increase the risk of hemorrhagic pericardial effusion.
Add a layer of realism by returning a mildly elevated troponin, which can occur with myopericarditis and does not by itself prove coronary occlusion. For advanced groups, escalate the case with falling blood pressure and muffled heart sounds so the learner must recognize emerging tamponade physiology, a topic that connects directly to the pericardial tamponade waveform planned for a later release.
2. Brugada Type 1
Download this waveform via theSimTech ECG/EKG Images Squiggler Database.
Electrophysiological Overview
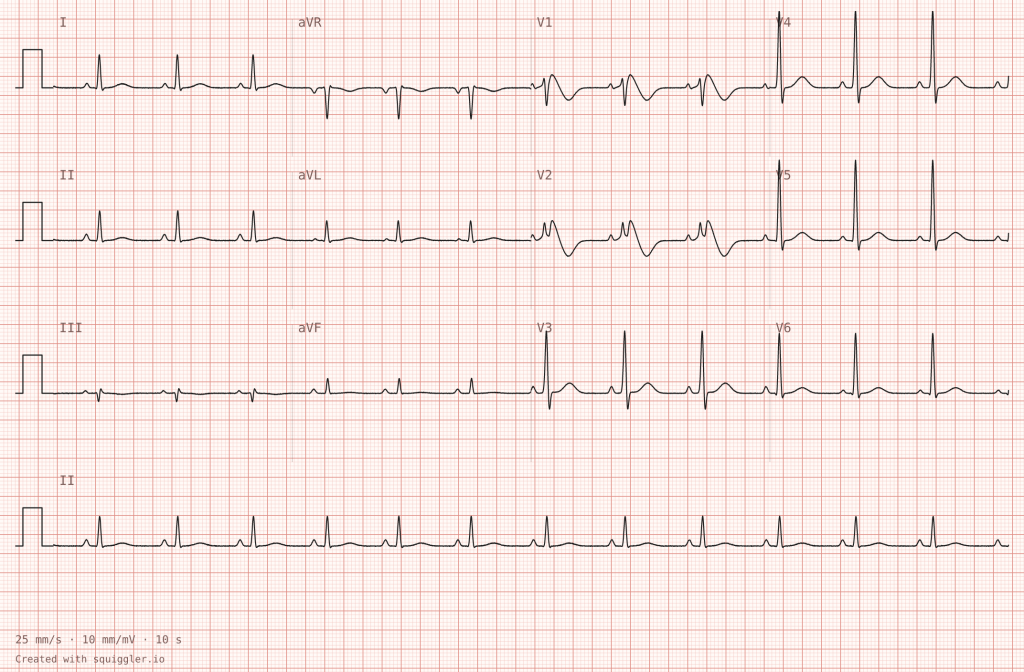
Brugada syndrome is an inherited cardiac channelopathy, frequently associated with variants in the SCN5A gene that affects cardiac sodium channel function. The defining type 1 ECG pattern consists of coved ST-segment elevation of at least 2 mm in one or more right precordial leads (V1–V2), descending into a negative, symmetric T wave. The morphology can resemble a right bundle branch block, but the dominant feature is the coved ST elevation rather than a broad terminal R wave.
The pattern can be intermittent. It may be unmasked or amplified by fever, sodium-channel-blocking medications, certain other drugs, and electrolyte disturbances. The clinical danger is polymorphic ventricular tachycardia or ventricular fibrillation, which often strikes at rest or during sleep and may present as syncope or sudden cardiac arrest. Educators should distinguish the Brugada pattern, an ECG finding, from Brugada syndrome, which combines the pattern with clinical features such as arrhythmia, syncope, or a family history of sudden death.
Key Diagnostic Features
- Coved ST-segment elevation of at least 2 mm in V1 and/or V2
- A coved segment that falls into an inverted T wave, rather than the upright T seen with a saddle-back (type 2) shape
- ST elevation confined to the right precordial leads, without the reciprocal inferior changes expected in an anterior STEMI
- A clinical context of fever, unexplained syncope, nocturnal events, or a family history of sudden cardiac death
Target Learner Cohort
Advanced: Critical care paramedics, Emergency Medicine residents, intensive care and cardiology trainees, and experienced emergency department nurses.
Pedagogical Strategy
Simplifying the Concept
The most efficient way to teach this waveform is as a comparison of ST-elevation shapes. Place the Brugada tracing next to a convex anterior ST elevation and ask learners to describe the shape of the segment as it leaves the QRS. The coved morphology, together with its confinement to V1–V2 and the absence of reciprocal change, gives novices a clear visual hook. Reinforce the key message that not every ST elevation in the right precordial leads represents ischemia, and that recognizing the pattern is the first step toward protecting the patient from the wrong treatment.
Challenging the Learner
Design a scenario around a febrile patient who has just experienced a syncopal episode. Fever is a recognized trigger, so the learner must treat the temperature promptly and aggressively, keep defibrillation pads on and ready, and avoid sodium-channel-blocking drugs. The scenario should punish reflexive cath lab activation or thrombolysis for what is not an acute coronary occlusion. If a ventricular arrhythmia is triggered mid-scenario, the learner should move straight into standard resuscitation and defibrillation.
This waveform also creates an elegant teaching link back to Part 1. A class I antiarrhythmic such as procainamide, which may be appropriate for pre-excited atrial fibrillation, can be harmful in a patient with a Brugada pattern. Asking learners to explain why the same drug class helps one patient and endangers another is a powerful exercise in pharmacological reasoning under pressure.
3. De Winter T Waves
Download this waveform via theSimTech ECG/EKG Images Squiggler Database.
Electrophysiological Overview
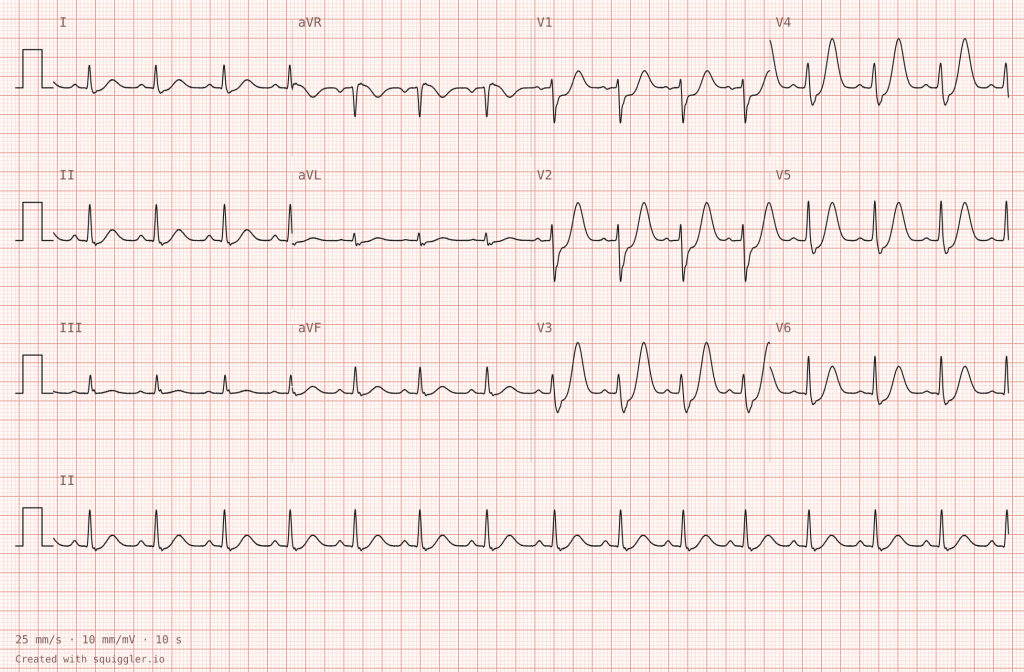
The De Winter pattern is a STEMI equivalent associated with acute occlusion of the proximal left anterior descending (LAD) artery. It is uncommon, reported in roughly two percent of anterior myocardial infarctions, and it matters precisely because it does not look like a conventional STEMI. Instead of ST elevation in the precordial leads, the tracing shows 1 to 3 mm of upsloping ST depression at the J point in leads V1 through V6, flowing into tall, prominent, symmetric T waves. Textbook descriptions place these changes across V1 through V6. In the synthetic waveform provided with this post, they are most pronounced in the mid-precordial leads (roughly V2 through V5), so the pattern is best described as occurring between V1 and V6. Lead aVR typically shows 1 to 2 mm of ST elevation, though this can be subtle on a given tracing. The underlying mechanism is not fully understood, but the clinical implication is clear: this pattern should be treated as an acute coronary occlusion requiring emergent reperfusion.
Key Diagnostic Features
- Upsloping ST depression at the J point in the precordial leads, between V1 and V6 (most pronounced in V2–V5 on this waveform)
- Tall, symmetric, broad-based T waves in the same leads
- ST elevation of about 1 to 2 mm in aVR, which can be subtle on a given tracing
- No ST elevation in the precordial leads that meets standard STEMI criteria
- A clinical picture consistent with acute coronary syndrome, such as ongoing chest pain or hemodynamic instability
Target Learner Cohort
Advanced and Specialist: Flight and critical care paramedics, Emergency Medicine and Critical Care physicians, cardiology fellows, and ACLS instructors.
Pedagogical Strategy
Simplifying the Concept
Use this waveform to teach one of the most important lessons in ECG interpretation: STEMI criteria are a floor, not a ceiling. Walk learners through the tracing and ask them what they would expect an LAD occlusion to look like. When the actual tracing shows ST depression rather than elevation, the discussion naturally opens onto the concept of STEMI equivalents. A side-by-side comparison with hyperkalemia, which also produces tall peaked T waves, helps learners appreciate why the clinical context, the ST depression pattern, and the aVR elevation matter.
Challenging the Learner
This rhythm is ideal for testing whether learners trust their own interpretation over a machine’s. Give the learner an ECG where the automated read says normal or nonspecific ST-T changes while the patient has ongoing crushing chest pain. The learner must override the algorithm, recognize the equivalent, and activate the catheterization laboratory without waiting for serial troponins. To add pressure, include a confederate colleague who argues that without ST elevation the patient can wait for a repeat ECG, and require the learner to advocate clearly and professionally for emergent reperfusion.
For an extended scenario, remind learners that LAD infarction can progress to infranodal conduction disease. Following the De Winter case with the Mobitz II waveform from Part 1 creates a chained scenario in which the learner must treat the infarct and prepare for pacing at the same time.
4. Lateral STEMI
Download this waveform via theSimTech ECG/EKG Images Squiggler Database.
Electrophysiological Overview
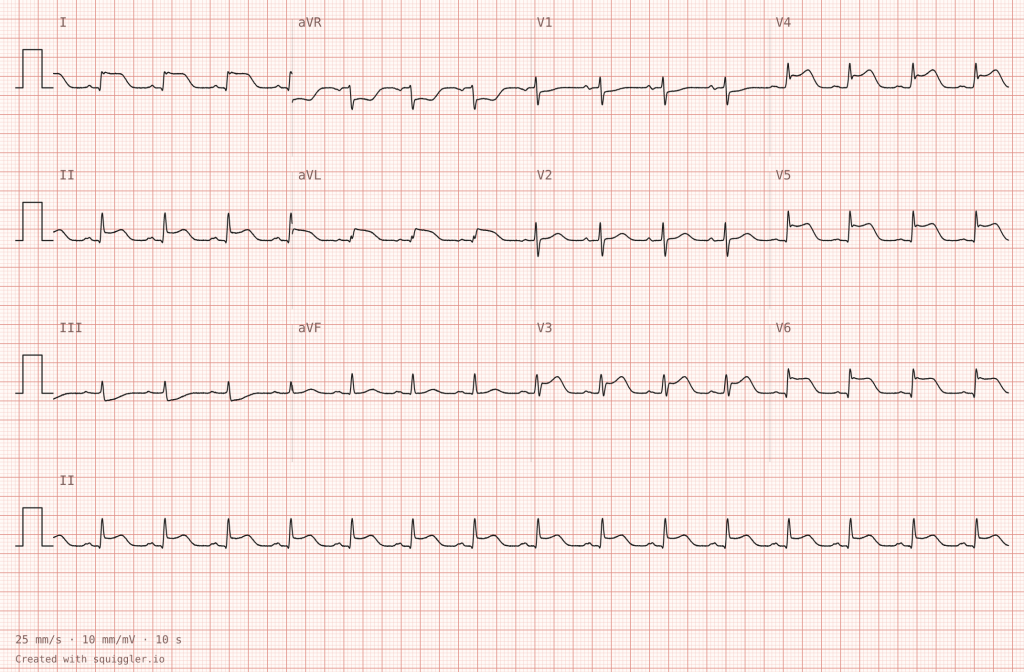
A lateral STEMI produces ST-segment elevation in the lateral leads: I and aVL (high lateral) and V5 and V6 (low lateral). The culprit is usually the left circumflex artery, a diagonal branch of the LAD, or an obtuse marginal branch. Because the territory is relatively small and the elevation can be subtle, isolated lateral infarcts are among the most frequently underrecognized STEMIs. The waveform provided with this post is deliberately clear, with the elevation also extending across V3–V6, which makes it a good baseline before learners meet subtler examples. Reciprocal ST depression in the inferior leads, particularly III, is often present and can be the earliest and most visible clue. Circumflex occlusions can also be electrically quiet on a standard 12-lead, so posterior leads (V7–V9) are worth considering when suspicion is high and the standard ECG is equivocal.
Key Diagnostic Features
- ST elevation in I and aVL, extending across V3–V6 in this waveform
- Reciprocal ST depression in the inferior leads, most evident in III
- Convex or straightened ST segments with associated T-wave changes, rather than the diffuse concave elevation of pericarditis
- A distribution that follows a coronary territory
- Possible posterior extension, suggested by ST depression in V1–V3, which should prompt posterior leads
Target Learner Cohort
Intermediate to Advanced: Paramedic students, ACLS and emergency nursing learners, and Emergency Medicine residents. It is a core objective for any prehospital STEMI curriculum.
Pedagogical Strategy
Simplifying the Concept
This waveform is the natural anchor for teaching lead groupings. Print a color-coded lead map: inferior (II, III, aVF), lateral (I, aVL, V5–V6), and anterior and septal (V1–V4). Have learners circle the leads with ST elevation and name the territory. Because the high lateral leads are easy to overlook, ask learners to check I and aVL on every ECG as a deliberate habit. Then ask them to find the inferior reciprocal changes and explain why those leads can reveal a lateral infarct that is otherwise easy to miss.
Challenging the Learner
Write a scenario with an atypical presentation, such as an older woman or a patient with diabetes describing fatigue, nausea, or vague arm discomfort rather than classic crushing pain. Run it as a prehospital case with a clock on the wall. The learner must acquire a 12-lead quickly, recognize the lateral elevation, transmit the ECG, give the pre-arrival notification, and activate the cath lab pathway while managing the patient en route. Debrief on time to first ECG and time to activation.
For the highest-level groups, run the lateral STEMI scenario immediately after the pericarditis scenario using the same actor and a similar complaint. Learners must apply the territory test and reciprocal change analysis to reach opposite conclusions, which is the most realistic test of true discrimination.
Teaching These Waveforms in Pairs
The four waveforms become more powerful when taught as contrasts rather than isolated cases.
Pericarditis versus lateral STEMI. Both can present with chest pain and ST elevation, but one follows a coronary territory with reciprocal depression and the other is diffuse with PR-segment changes. This pairing trains the single most important discrimination in emergency ECG interpretation.
Brugada type 1 versus De Winter T waves. Both involve striking right and anterior precordial abnormalities, yet they call for opposite responses. One carries arrhythmic risk and demands trigger avoidance and defibrillator readiness; the other demands emergent reperfusion. Learners who can explain the difference have moved beyond pattern matching and into mechanism-based reasoning.
Chained scenarios with Part 1. Combining a waveform from this release with one from the first release builds multi-stage cases. An LAD occlusion with a De Winter pattern that progresses to Mobitz II block, or a febrile Brugada patient who then needs an arrhythmia strategy, mirrors the way real patients change over time.
Frequently Asked Questions
What is a STEMI equivalent? A STEMI equivalent is an ECG pattern that indicates acute coronary occlusion without meeting the standard millimeter criteria for ST elevation. The De Winter pattern is a well-known example, and it should prompt the same emergent reperfusion pathway as a conventional STEMI.
How can learners tell acute pericarditis from a STEMI? Pericarditis usually shows diffuse concave ST elevation across multiple territories, PR-segment depression, and ST depression with PR elevation in aVR, without reciprocal ST depression elsewhere. A STEMI follows a coronary territory and typically shows reciprocal change. Clinical context, such as positional pleuritic pain after a viral illness, supports pericarditis.
Does a Brugada type 1 pattern require emergency catheterization laboratory activation? No. The pattern is not an acute ischemic finding. Management centers on identifying and removing triggers such as fever, avoiding sodium-channel-blocking drugs, preparing for ventricular arrhythmia, and arranging cardiology or electrophysiology evaluation, following local protocols.
Why use synthetic ECGs for simulation? Synthetic ECGs are free of patient identifiers, artifact, and the inconsistent print quality that often affects real tracings. Educators can show exactly the findings they want to teach, in a consistent format, across scenarios and cohorts.
Which learner levels are these waveforms designed for? They span intermediate to specialist levels. Pericarditis and lateral STEMI suit intermediate learners and can be extended for advanced groups, while Brugada type 1 and De Winter T waves are best suited to advanced and specialist learners.
Curricular Deployment Notice
This release is the second of three planned drops of synthetic 12-lead ECG waveforms for simulation education. The first drop is covered in Part 1.
Active File Access
Release Phase II is now live. The waveforms in this article are available for download in theSimTech ECG/EKG Images Squiggler Database:
- Acute pericarditis
- Brugada type 1
- De Winter T waves
- STEMI lateral
The simulation-ready synthetic digital waveforms were compiled and contributed by Squiggler.io, providing open-access resources to enhance medical simulation training globally. These waveforms are intended for educational use in simulation. They are not a substitute for clinical judgment, and scenario treatment pathways should always be aligned with your local protocols and medical direction.
Upcoming Releases
Release Phase III
- Pulmonary embolism (S1Q3T3)
- Hypothermia (Osborn waves)
- Pericardial tamponade (low voltage, electrical alternans)
- Long QT